Wacky Forecast Distributions
- Bill Kantor

- Sep 13, 2024
- 3 min read
Updated: Jun 11, 2025
If you have a 20% chance of winning $100 bet, statisticians would say the bet has an "expected value" of $20 (20% of $100). It's how much you can expect to get on average—if you make that bet many times.
So what’s the expected value of a $10 lottery ticket? About $5. But that doesn’t tell you much. Because most of the time the payout is zero. Occasionally it pays out millions.
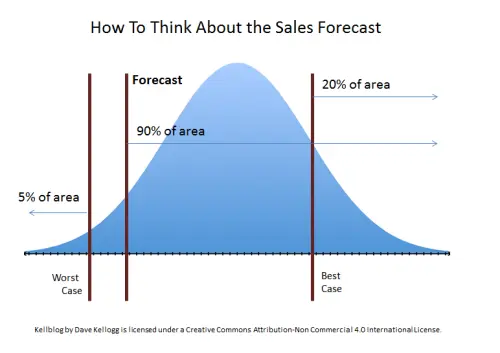
Hold that thought. Dave Kellogg has blogged that you need to train your VP of sales how to think about the forecast. His blog is about forecast distributions. And we agree. We all need to understand this. Here is how Dave presents it in his blog.

You can easily see that if you call the Forecast at the middle line, that there is a 90% chance that you will exceed that figure.
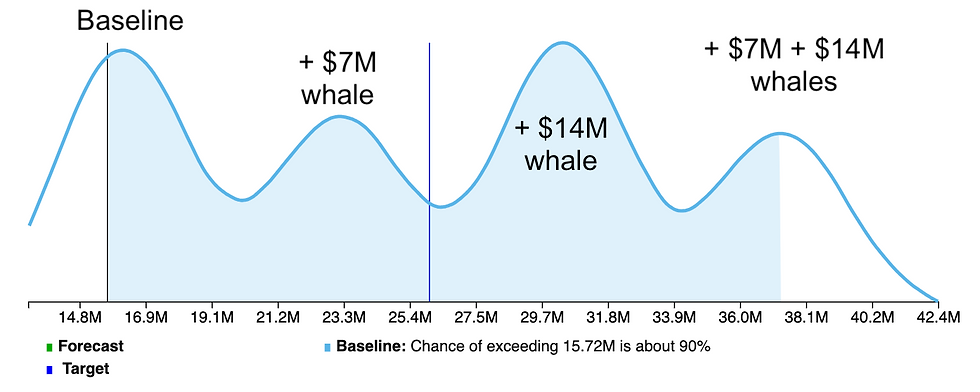
But forecast distributions are sometimes not that neat. Here’s a distribution of possible sales for a quarter. It looks a lot different.

What's going on here is something similar to, but not as severe as, the lottery example. The average forecast (right vertical line) is $26M, but the range (the blue area, an 80% prediction interval) is from $15.7 to $35.4M. A pretty large range. Not that helpful. Also, the average forecast is relatively unlikely to happen compared to the other peaks. It’s less meaningful than in the lottery example. You can play the lottery many times. You are only going to play out this quarter once.
So how do you forecast this? A conservative forecast for this business (one that would be exceeded nine times out of ten) would be the left edge (blue vertical line) of the shaded prediction interval: $15.7M.
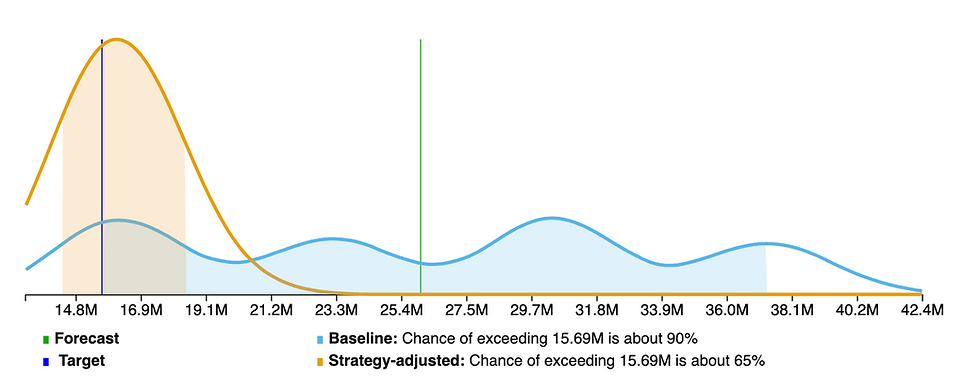
What causes this distribution to look like two (bactrian) camels? There are two very large (one $7M and another $14M) deals. The business (excluding these two whales) is composed of many smaller deals that have an average forecast of about $16M with a forecast distribution like Dave Kellog's example. Here is what that looks like (beige).

If neither of the whales come in, then the forecast looks like this. Note that what was a 90% certain figure (blue vertical line) is now only 65% certain.
Maybe you would want to revise your forecast call based on this possible outcome. That’s what you would do if you had new information saying that neither whale is likely to happen in this forecast period. The new conservative (90% certain figure) is lower, about $14.4M—the left edge of the beige shaded area.
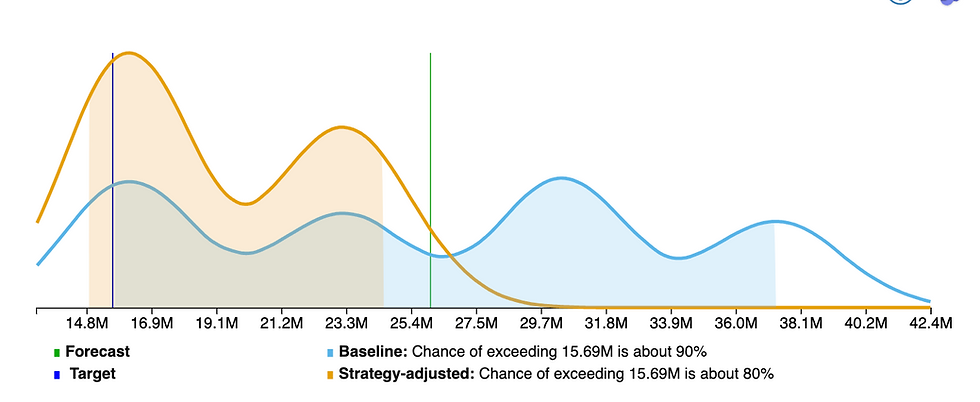
If the $7M deal is in play and the $14M deal is not going to happen, then things look like this.

Just one camel this time. And the conservative figure we called initially, is now only 80% certain.
There are other possibilities and you can see how two whale deals plus the baseline business creates four humps.

The point of all this is that the average is not that helpful. Even if you have a one-humped forecast distribution like in Dave Kellogg's example, the average is a figure you would exceed about 50% of the time. Is that what you want to forecast? In this case you have four "modes" (peaks) of where this business will land. And the only way to get your arms around it is to see the forecast distribution—and speculatively win or bin those mega deals. Your forecasting software should do that for you.
Here’s how to do that for yourself if you prefer. Or you can save that time. Sign up for a Funnelcast free trial and see for yourself in just a few minutes.
See how to sell more. Try Funnelcast. |


Comments