
The Problem With Commit: It Conflates Forecasting and Focus

Updated: Jul 23
Sales leaders use Commit and other Forecast Category rollups for two different jobs.
To forecast.
To focus (allocate resources).
Rollups drive forecasts and deal reviews. They help sales leaders to get their arms around their business and prioritize work. Commit deals In particular give managers a concrete closing list to focus on. By "focus" I mean it drives the order and intensity of deal reviews, and resource allocation.
This combined use for forecasting and focus works very well at quarter end—when there is not much else sellers can do to shape the quarter.
The problem is that many businesses also use Commit (and sometimes other Forecast Categories) rollups for both forecasting and focus—throughout the quarter. And—other than the last two to three weeks of the quarter—Commit is bad at both.
Here's why.
We analyzed 11,137 won deals across 50 company-quarters to evaluate how useful Commits are for forecasting. [1] The results (figure 1) highlight severe limitations. In another study, we assessed Commit's usefulness for focusing resources. (With similarly discouraging results discussed below.)

The data confirms what sales leaders already know intuitively: If you scrub the pipeline, Commit deals (with a close date in the current quarter) are reasonably reliable.
On average, 80% of Commit deals closed in their committed quarter. Across company-quarters, 80% of results ranged from 65% to 93%.
That is pretty good. Notably though, we find that most sales leaders believe their in-quarter Commit success rate is in the high 90s. The data don't support that notion.
Still, 80% win rate in quarter is pretty good. But here's what makes Commit such a bad way to run the business.
The mean time from Commit to Closed Won was only 11 days. The median was just 7 days. In 80% of company-quarters, the mean ranged from 6 to 20 days.
While Commit deals are reliable, they tend to become Commit just a few days before they close.
Commit represented on average, only 57% of total sales. Across company-quarters, that ranged from 42% to 84%.
So Commit gives managers a reliable view of a subset of the business that is likely to close very soon. [2]
That can be useful at the right time. But it is not a complete forecast of the whole business. It encompases open pipeline only and ignores prospective new pipeline that may be created and close in the quarter. It is not a good way to forecast or to decide where the team should focus before the quarter end is near.
Why Commit Works at Quarter-End
In the final two to three weeks of a quarter, there may not be much else you can do.
The remaining job is largely control:
Inspect and de-risk the deals most likely to close.
Remove obstacles.
Escalate commercial or legal issues.
Set expectations and avoid surprises.
At that point, a Commit list can be the best available management tool. The deals are close to closing. With days left, sales leaders are not thinking about how to reshape the quarter. Rather, they are asking, “What can we get across the line?" and "How should we set management expectations?"
That is a great use of Commit.
Why Commit Fails Earlier
Earlier in the quarter, managers and sales teams have a different job.
At this point they are thinking about how to shape the quarter. They need to decide which deals and demand-generation are most likely to improve the result—by quarter end.
Commit does not support longer-term planning. It is biased toward the short-term safest opportunities. And it directs management time toward deals that already have a relatively high likelihood of closing, rather than toward a portfolio of opportunities where attention can create the most sales by the end of the quarter.
This is the core mistake: using Commit as both the forecast and the focus list. It is too narrow for both purposes early in the quarter—when other deals may come into play.
Expanding it to include Best Case (or other Forecast Category) deals may actually make things worse. You'll have another set of forecasts without much understanding of how likely they are. The list may become too broad for prioritizing resources. Overlaying management opinions may tame these issues but there are better ways to forecast and allocate resources when there is more time to affect the outcome.
Using Commits early in the quarter risks turning into forecast theater.
Reps spend time submitting Commit (and Best Case) deals. Managers debate them. Leaders roll them up into a number, then make up another number based on their judgment of Commit plus Best Case. Their managers do the same. You get a made up number, based on a made up number, based on made up forecast category calls. [3]
Then resources mostly go to the deals that were already safest enough to be called.
Rinse, repeat next week.
That is the Commit treadmill. It keeps you focused on the short-term minimum instead of the longer-term maximum.
For more on why Forecast Category/Commit rollups create this problem, read our blog Forecast Category Considered Harmful.
Forecasting and Focus Should Be Separate
The better approach is to separate the two jobs—particularly early in the quarter.
Forecast the business using the actual behavior of the full sales engine: the empirical behavior of previous similar open deals plus, prospective new pipeline that could be created and closed in the remaining time. The output of this forecast is not a number, but rather an estimated distribution of possible outcomes. And the width of that distribution is a measurement of risk.

That gives you a realistic baseline forecast and estimated odds of beating any figure. Then separately decide where to focus resources—without increasing the width of the distribution. We call this the Focus list: the deals where additional attention maximizes sales while controlling for risk.
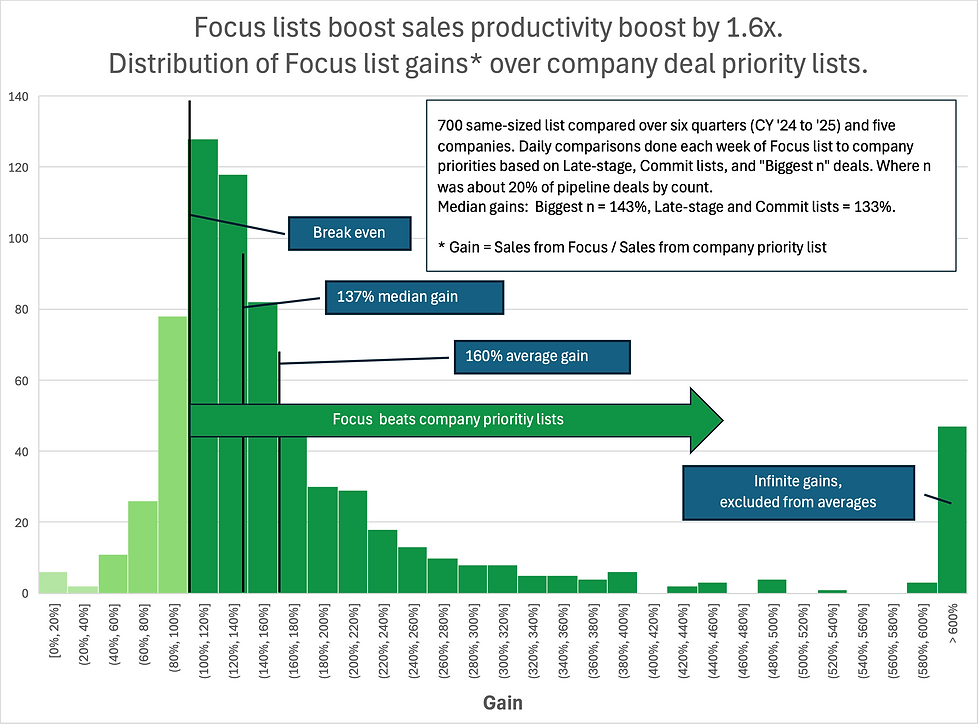
I mentioned earlier another study in which we found that company priority lists (we tested Commits, late stage, and the biggest n deals) performed poorly for resource allocation. The study included 700 paired comparisons between same-sized Focus and company priority lists, On average, Focus lists produced 60% more in-quarter sales. (Distribution of results summarized in figure 3.) Read the full case study. This highlights the value of broadening resource allocation to focus on deals outside of the Commit list—particularly early in a quarter.
Building those Focus lists takes some computational work. If you want to code your own, read our blog and case study to understand the approach—or just use Funnelcast to receive an optimized daily Focus list and forecast. Start with that list and at the very least, you will be more productive. You'll also probably sell more.
Instead of relying on Commit rollups early in the quarter, this approach yields:
A more realistic view of the whole business (throughout the quarter).
A clearer understanding of the odds of beating any figure.
A better way to direct resources toward the deals most likely to improve the quarter.
Commit still has a role—as a endgame control tool.
But earlier in the quarter, leaders need more than a Commit list. They need a realistic view of what the business is likely to produce—and a clear view of where additional attention can most improve that outcome.
Those are different questions—not addressed by Commit.
The best approach is to answer both from the same underlying sales data:
What is likely to happen if nothing changes?
And what should we do differently to sell more while controlling risk?
That is the difference between managing to deliver the Commit and optimizing the business.
All seven companies included were B2B technology businesses that had active processes to scrub their Commit and other Forecast Category classifications. To avoid small sample outliers, each company-quarter included more than 20 won deals. The stats omit same-day-commit-and-close deals.
We thought that there would be an inverse relationship between the mean time for a Commit to close and their win rates. We looked for and could only find this correlation in one company (with just 8 observation). Here it is for all 50 company-quarters. More broadly, we looked for and found no pairwise correlation among all three factors explored. More rigorous Commit scrubbing may improve Commit win rates (an unproven assumption), but does not seem to affect the mean time to close or the percent of the total quarter that get's committed.

Commit win rate (in-quarter) is uncorrelated with the mean time to close. We expected an inverse correlation but could not find evidence of this—either within a company or across companies as shown here. The Forecast Category and management override process proliferates forecasts. At the individual contributor level, you have two forecasts: Commit and Best Case. At each management level, you have two other made up figures. With three management levels, created every week, this produces 78 (13 * 6) different figures. One of them is bound to be close. But that particular call won't be repeatable next quarter. In contrast to this approach, the forecast distribution (figure 2) provides more context—an estimate of the odds of beating any figure.


Comments